By Scott Gaertner, Associate Broker
Hope you’re all doing well and staying cool! For those who’ve been faithfully following our regular statistical deep dives into the Scottsdale North real estate scene (and a big thanks to those who have!), we’ve got a tweak to our approach that you’ll want to hear about.
Over the years, my Scottsdale North market updates have used the primary lens of the 85266 zip code statistics because it is the geographic heart of the area. And it has been, and will continue to be, a good compass to help you navigate the world of real estate in our region. But we figured, why not cast our net a bit wider for a fuller statistical picture?
So, here’s the plan: From here on out, we’re crunching numbers from all three of our key zip codes – 85255, 85262, and 85266.
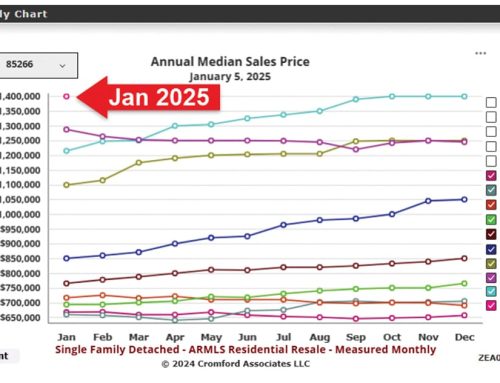
We have compiled that data into a series of charts.
There’s more data, more precision, and a broader view of what’s happening in our neck of the woods.
Here’s why this is a win for you:
The Complete Stats: By pulling data from all the zip codes, we get a more comprehensive view of the stats across Scottsdale North. The broader our data source, the stronger our predictive power becomes.
Sharper Insights: Our central zip code has been gold for general trends, but adding in the other two will give us those nitty-gritty details that can make all the difference.
Informed Decisions: With a wider set of numbers, you’ll be better equipped, whether you’re considering selling, buying, or just keen to keep your finger on the pulse of our local market’s health.
We’re all about giving you the clearest, most detailed stats on Scottsdale North’s real estate scene. And this change? We’re thinking it’s like upgrading our calculator to a supercomputer.
On the back page of this month’s newspaper, we have some charts that we will be tracking. As they are laid out there, it is way too much information for most people. I just want to introduce them to you. In the coming months though, I can use these charts to detail the trends we are seeing. Let’s begin with an example.
The largest trend nationally and locally is low inventory, so let’s start there.
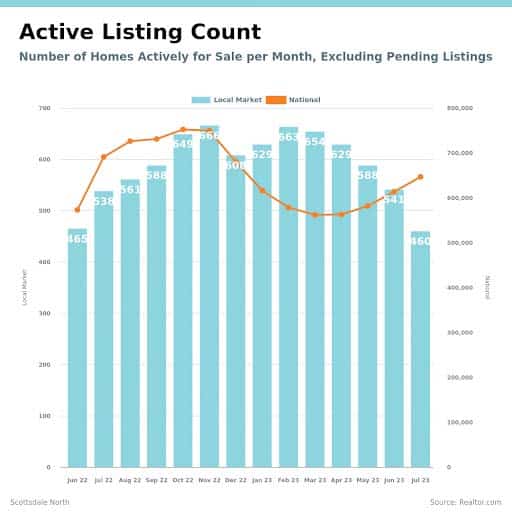
The bars in the Active Listing graph at left show how many houses are on the market right now locally, in the three zip codes. And how many there were over the last 12 months. The orange line at the top details how many homes are available for sale nationally. Seeing this in a visual form should make it clear to see that inventory nationally is trending upward, but locally we are still in decline. That is great news for homeowners – and terrible news for buyers. Demand still exceeds supply. This is why our prices are continuing their upward trend.
In the heart of Scottsdale North, our community thrives, and understanding our real estate landscape is essential for all of us. By broadening our perspective, we aim to keep you, our dear neighbors, best informed and empowered. As we dive into broader data, we promise deeper understanding and clearer decision-making. Remember, this isn’t just data—it’s our shared home story.
 So, let’s keep the conversation going! To stay connected and informed, pop over to our YouTube page for our MarketMinute video updates at bit.ly/ScoNoMarketMinute or give that QR code a quick scan. They are mostly under two minutes and will keep you informed.
Together, as a community, we’ll shape the future of our beloved Scottsdale North.

Scott Gaertner is an Associate Broker with Keller Williams Arizona Realty who for the past 35+ years has helped more people find their lifestyle niche in the Scottsdale North area than anyone else. He also contributes his thoughts on the real estate market and lifestyle interests in the area and is the creator of ConnectingScottsdaleNorth.com. For additional info, visit scottgaertnergroup.com or call 480-634-5000.

